Numbers(C/R) is the extension of the ML Environment that deals with the classification and regression of numeric data.
Datasets on the internet are hardly ever fit to directly train on. Programmers often have to take care of unnecessary columns, text data, target columns, correlations, etc. Thankfully, PictoBlox’s ML Environment is packed with features to help us pre-process the data as per our liking.
Opening Number (C/R) Workflow
Alert: The Machine Learning Environment for model creation is available in the only desktop version of PictoBlox for Windows, macOS, or Linux. It is not available in Web, Android, and iOS versions.
Follow the steps below:
- Open PictoBlox and create a new file.
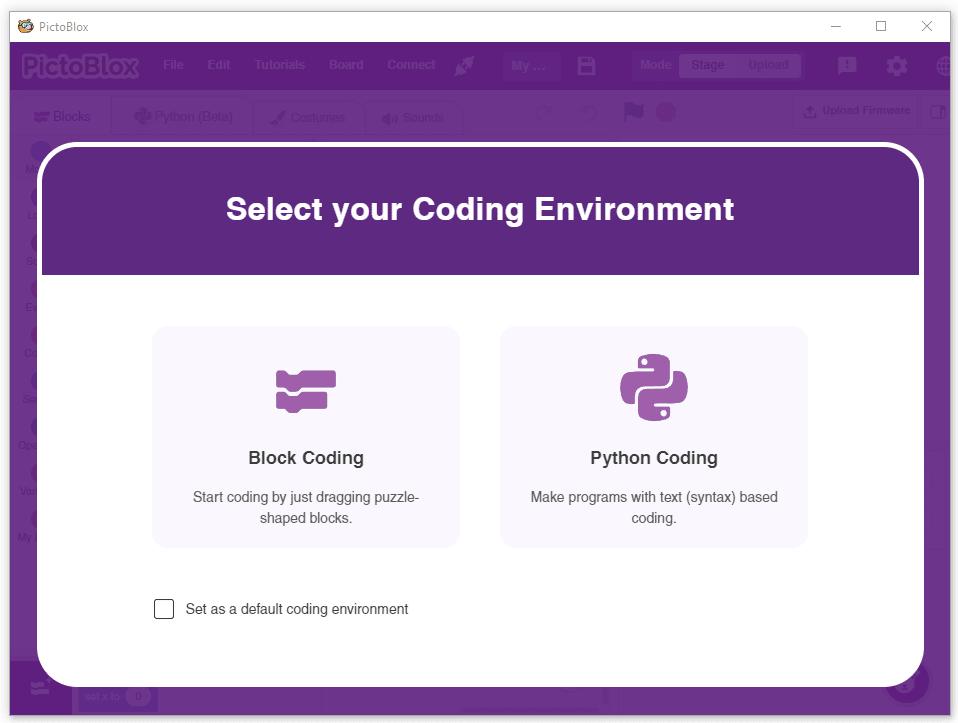
- Select the coding environment as appropriate Coding Environment.
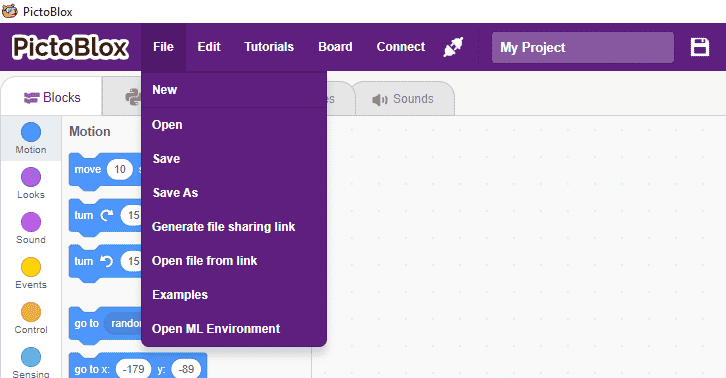
- Select the “Open ML Environment” option under the “Files” tab to access the ML Environment.
- You’ll be greeted with the following screen.
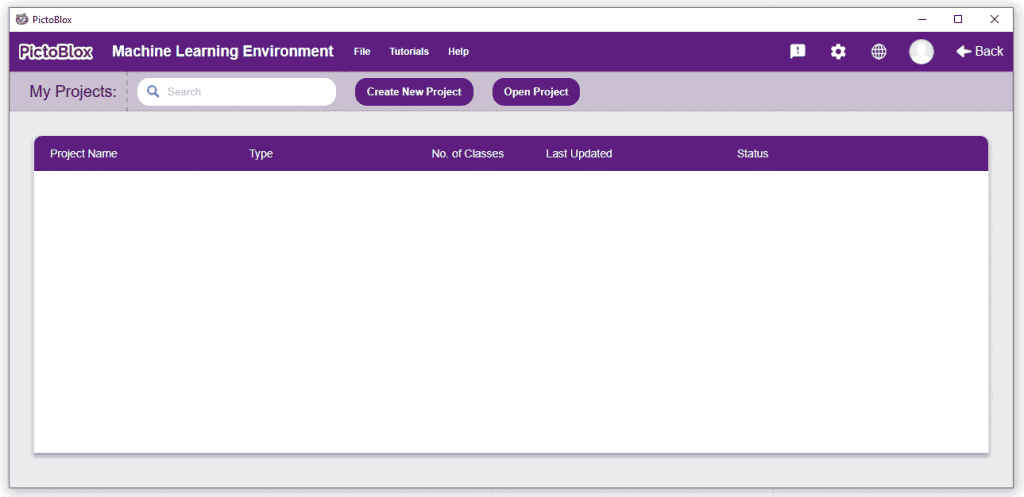 Click on “Create New Project“.
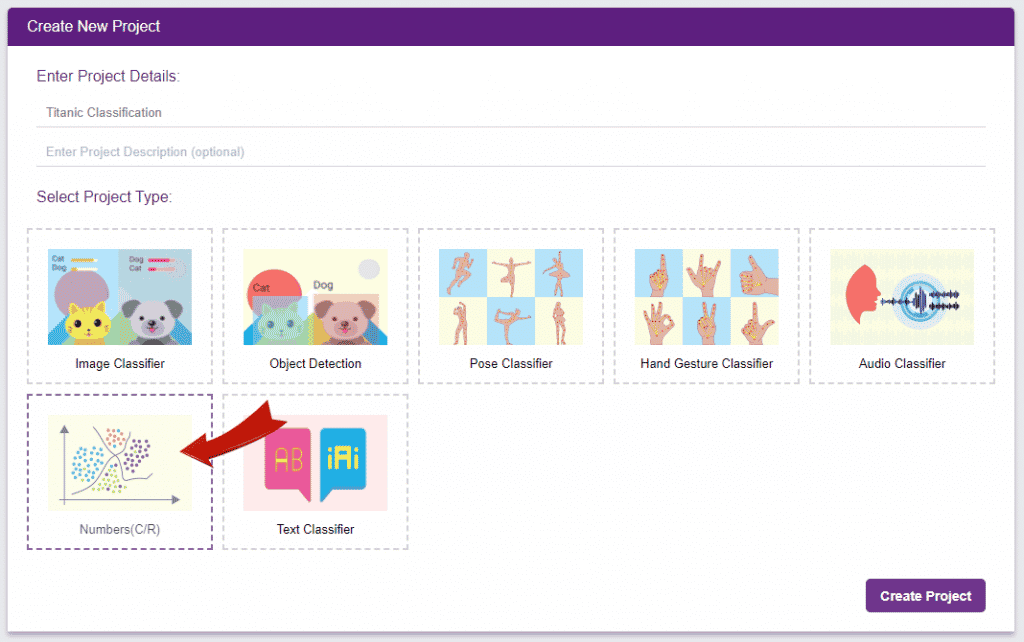
- A window will open. Type in a project name of your choice and select the “Numbers(C/R)” extension. Click the “Create Project” button to open the Numbers(C/R) window.
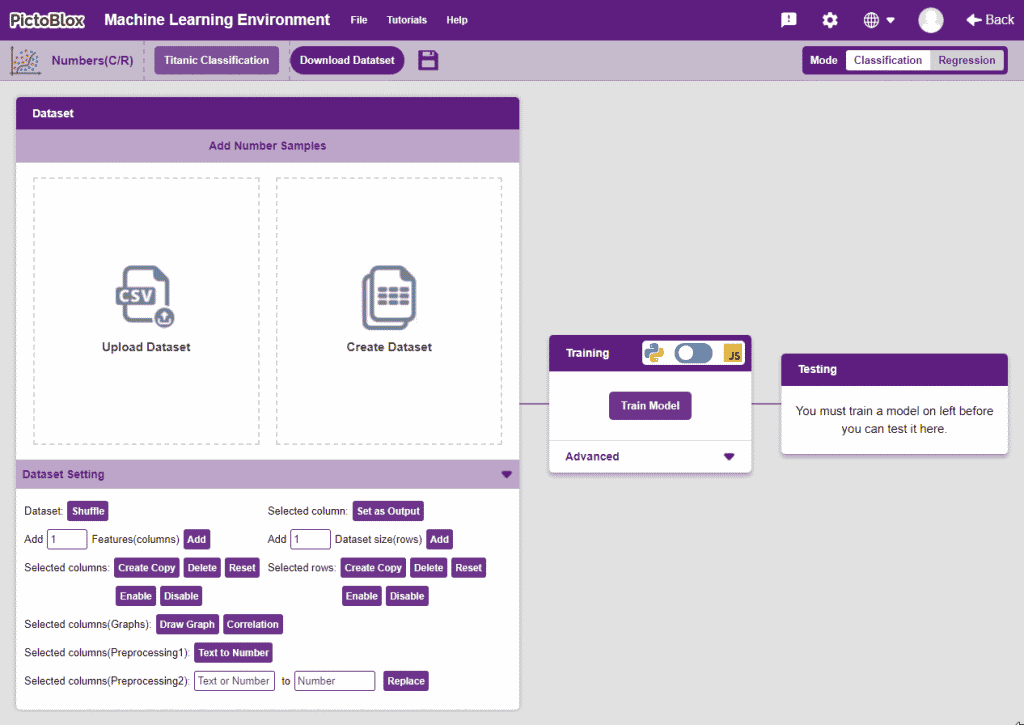
- You shall see the Numbers C/R workflow with an option to either “Upload Dataset” or “Create Dataset”.
Uploading/Creating Dataset
Datasets can either be uploaded or created on the ML Environment. Lets see how it is done.
Uploading a dataset
- To upload a dataset, click on the Upload Dataset button and the Choose CSV from your files button.
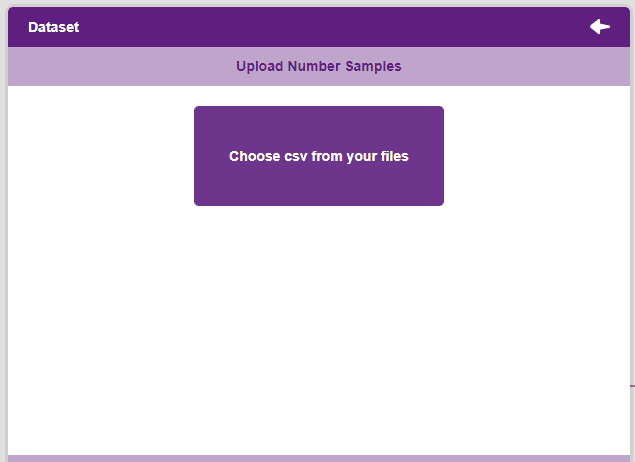
Note: An uploaded dataset must be a “.csv” file.
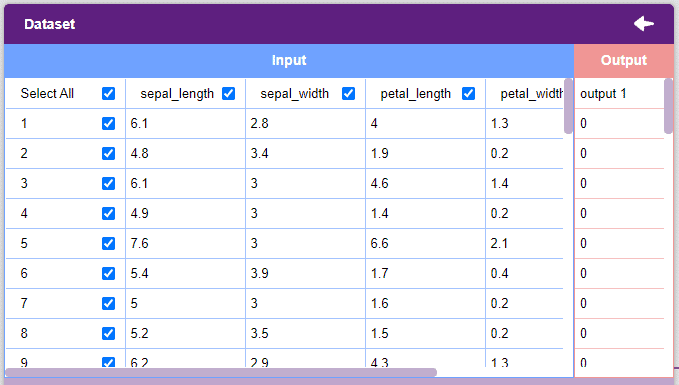
- Once uploaded the first 50 rows of the uploaded CSV document will show up in the window.
Creating a Dataset
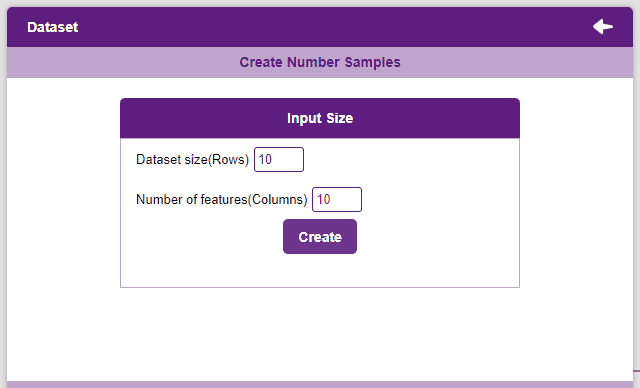
- To create a dataset, click on the Create Dataset button.
- Select the number of rows and columns that are to be added and click on the Create button. More rows and columns can be added as and when needed.
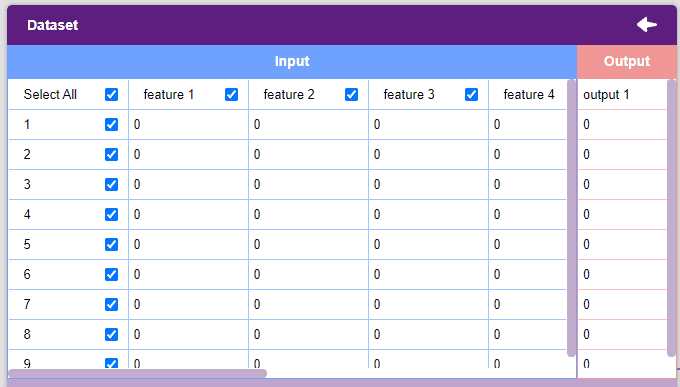
- The dataset will appear in the window with every value set to 0. Click on the values to edit them.
Notes:
- Each column represents a feature. These are the values used by the model to train itself.
- The “Output” column contains the target values. These are the values that we expect the model to return when features are passed.
- The window only shows the first 50 rows of the dataset.
- Un-check the “Select All” checkbox to un-select all the columns.
“Dataset Setting” Section
This section contains functions that help in pre-precessing the data.
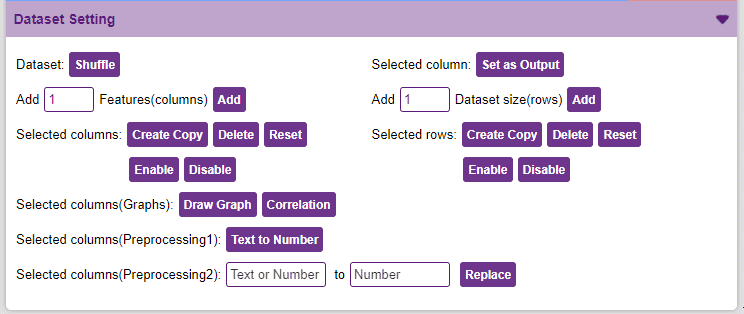
- Dataset Shuffle: This function shuffles the rows of the dataset. This can often lead to better training and testing results. Simply click on the button to shuffle the dataset.
- Set as Output: This button sends the selected column to the “Output” column. This will convert the column into the target column.
Alert: The target column must be a numerical column. If not numerical, the column must be converted into one (refer to the “Text to Number” function).
- Features Manipulation: The column is the features for which you will train the data. There are a lot of options available to edit it:
- Add Features: This function adds the given number of columns to the dataset.
- Create Copy: Creates a copy of the selected column.
- Delete: This option deletes the selected columns.
- Reset: This option resets all the data of the selected columns.

- Disable: This option does not delete the selected column but excludes it from training, i.e. the column becomes invisible to the model.
- Enable: This option enables a previously disabled column.
- Selected rows: Create Copy, Delete, Reset, Enable, Disable options are similar to the column.
- Selected columns(Graphs): These are visualization methods that help in making sense of the data. They can also be used to remove unnecessary columns from the dataset.
- Draw Graph: Plots the values of the two selected columns on the x-y plane. Helps in visualizing the relation between two columns.
Note: Can only be used for two columns at once.
To draw a graph, simply select the two columns, and click on the “Draw Graph” button.
- Correlation: Correlation denotes the relationship between the columns of a dataset. Highly correlated columns create redundant features that are not of significance in the model training, such columns are best disabled. This technique is extremely helpful when dealing with datasets with a large number of columns as they can often slow down and sometimes adversely affect training. Correlation can be observed between two columns as well, but it’s often more useful to observe correlation for the entire dataset.
Alert: Make sure that no particular columns are selected and click on the “Correlation” button.
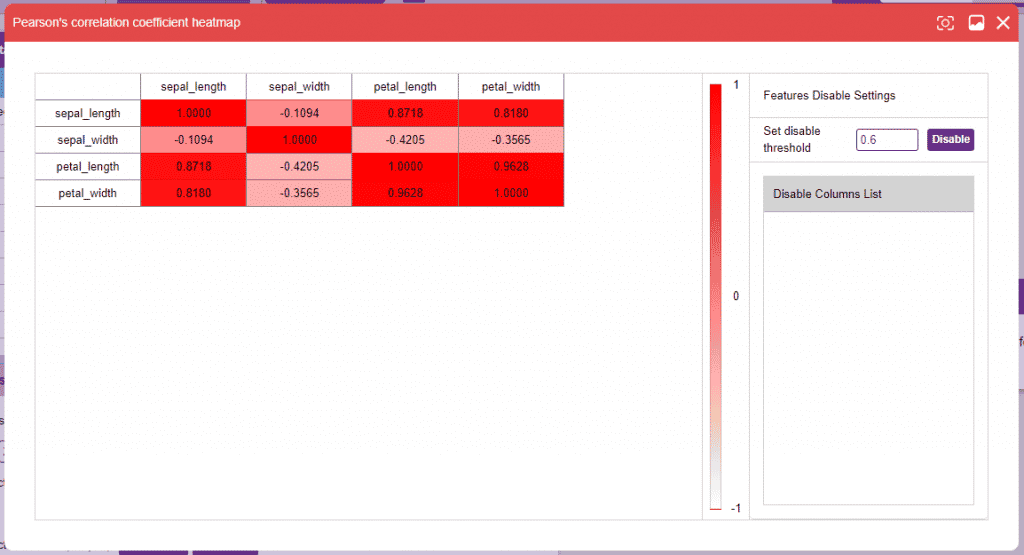 The range of correlation is (-1,1). It’s always a good idea to drop a column with an extremely high correlation with another. Set the threshold on the right side panel and click on the “Disable” button to disable the column(s).
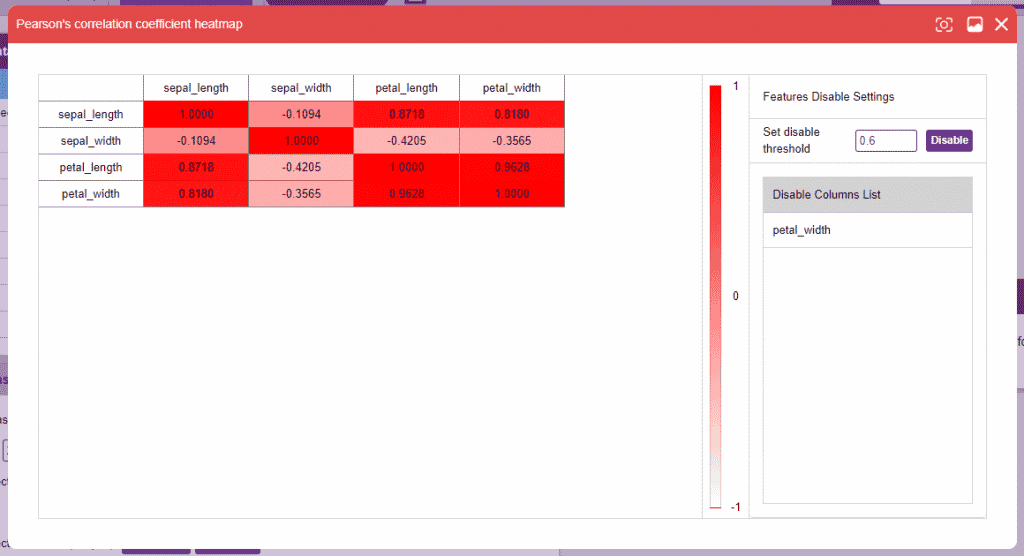
- Text to Number: The “Text to Number” button assigns a number to all the unique values in a column. If a column has three unique values, they will be assigned corresponding numbers starting with 0. Hence, the values in the case of three unique values would be 0, 1, and 2.
Note: Notice how each species has been assigned to a unique number. This method is also called “Label Encoding”.
- Replace: Replaces a particular number of a column with another number. To replace all the instances of 3 in column “SepalWidthCm” with 11, select the column, do the desired changes, and click on the “Replace” button.
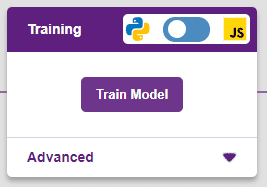
Training the Model
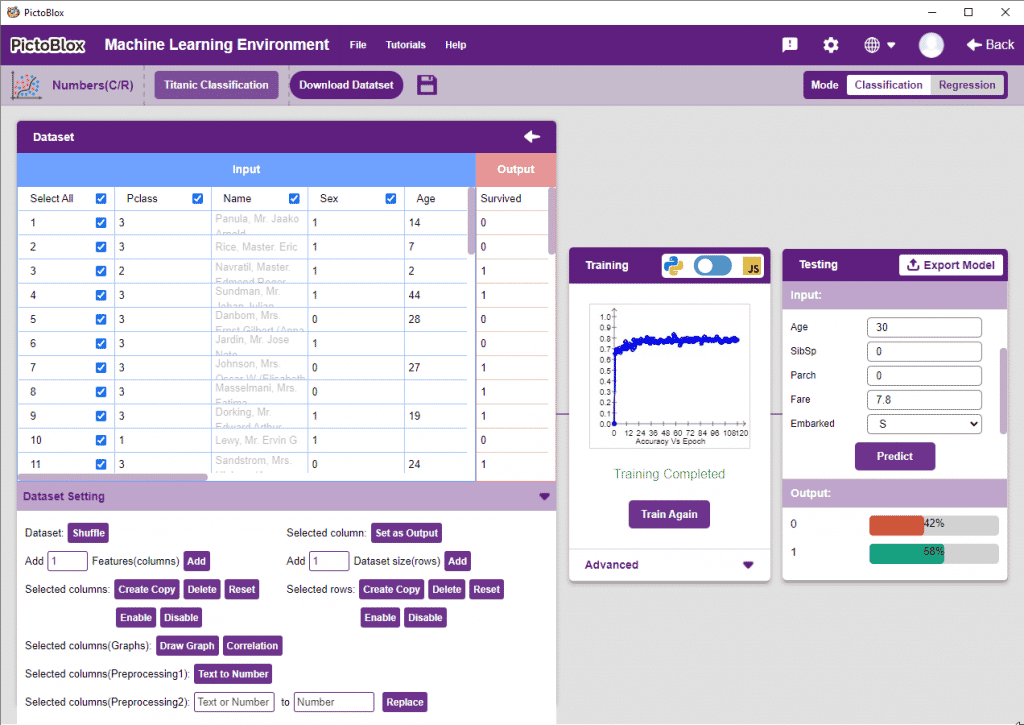
After data is pre-processed and optimized, it’s fit to be used in model training. To train the model, simply click the “Train Model” button found in the “Training” panel.
By training the model, meaningful information is extracted from the numbers, and that in turn updates the weights. Once these weights are saved, the model can be used to make predictions on data previously unseen.
The model’s function is to use the input data and predict the output. The target column must always contain numbers.
However, before training the model, there are a few hyperparameters that need to be understood. Click on the “Advanced” tab to view them.
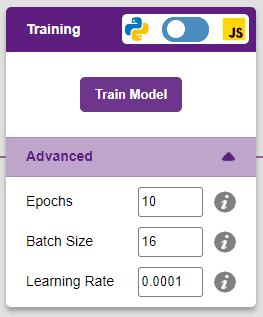
There are three hyperparameters that can be altered in the Numbers(C/R) Extension:
- Epochs– The total number of times the data will be fed through the training model. Therefore, in 10 epochs, the dataset will be fed through the training model 10 times. Increasing the number of epochs can often lead to better performance.
- Batch Size– The size of the set of samples that will be used in one step. For example, if there are 160 data samples in the dataset, and the batch size is set to 16, each epoch will be completed in 160/16=10 steps. This hyperparameter rarely needs any altering.
- Learning Rate– It dictates the speed at which the model updates the weights after iterating through a step. Even small changes in this parameter can have a huge impact on the model performance. The usual range lies between 0.001 and 0.0001.
Note: Hover the mouse pointer over the question mark next to the hyperparameters to see their description.
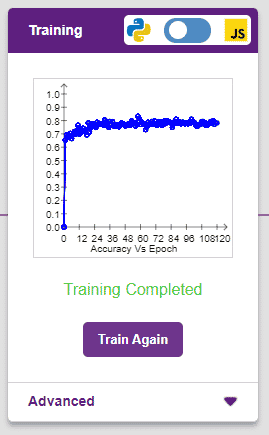
It’s a good idea to train a numeric classification model for a high number of epochs. The model can be trained in both JavaScript and Python. In order to choose between the two, click on the switch on top of the Training panel.
Alert: Dependencies must be downloaded to train the model in Python, JavaScript will be chosen by default.
The accuracy of the model should increase over time. The x-axis of the graph shows the epochs, and the y-axis represents the accuracy at the corresponding epoch.
Testing the Model
To test the model, simply enter the input values in the “Testing” panel and click on the “Predict” button.
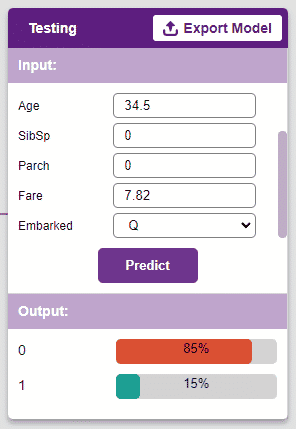
The model will return the probability of the input belonging to the classes.
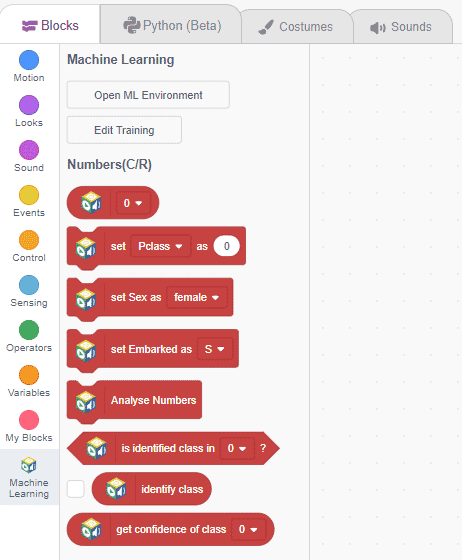
Export in Block Coding
Click on the “Export Model” button on the top right of the Testing box, and PictoBlox will load your model into the Block Coding Environment if you have opened the ML Environment in the Block Coding.
Export in Python Coding
Click on the “Export Model” button on the top right of the Testing box, and PictoBlox will load your model into the Python Coding Environment if you have opened the ML Environment in Python Coding.
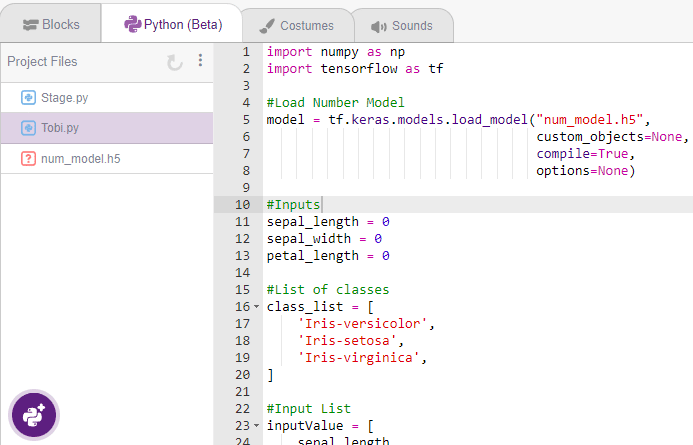
The following code appears in the Python Editor of the selected sprite.
import numpy as np
import tensorflow as tf

#Load Number Model
model = tf.keras.models.load_model("num_model.h5",
                                   custom_objects=None,
                                   compile=True,
                                   options=None)

#Inputs
sepal_length = 0
sepal_width = 0
petal_length = 0

#List of classes
class_list = [
    'Iris-versicolor',
    'Iris-setosa',
    'Iris-virginica',
]

#Input List
inputValue = [
    sepal_length,
    sepal_width,
    petal_length,
]

#Input Tensor
inputTensor = tf.expand_dims(inputValue, 0)

#Predict
predict = model.predict(inputTensor)
predict_index = np.argmax(predict[0], axis=0)

#Output
predicted_class = class_list[predict_index]
print(predicted_class)
Note: You can edit the code to add custom code according to your requirement.